Chapter 5 of 11
Valuing a dividend stock
A fair price matters as much as a safe dividend. A few classic frameworks turn yield, growth and history into a buy-or-wait read.
Even a great dividend can be a poor buy if you overpay. These frameworks each look at value from a different angle — lean on several rather than trusting any one.
The Chowder number adds a stock's current yield to its 5-year dividend growth rate; a common rule of thumb wants at least 8% for higher-yield stocks (yield above 3%) or 12% otherwise — a quick gauge of total dividend-return potential.
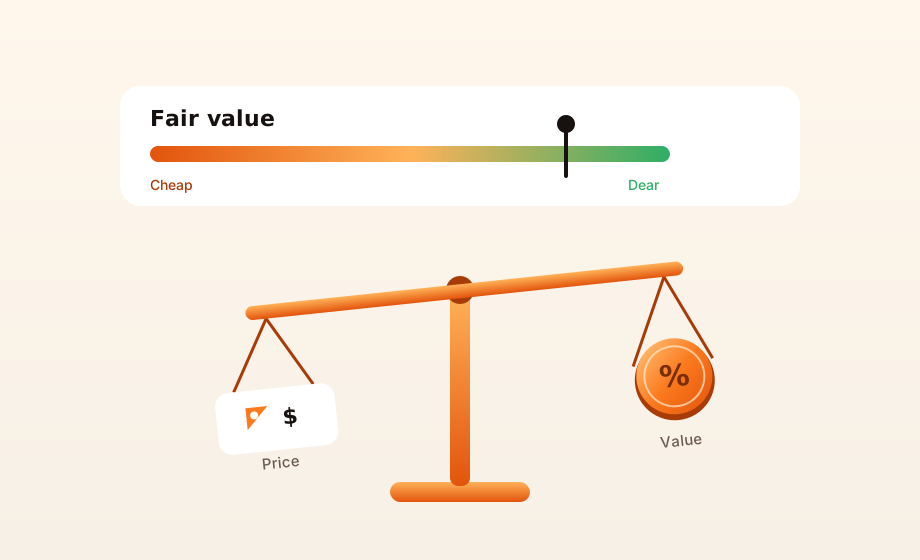
A dividend discount model (the Gordon Growth model) estimates a fair price from the dividend itself: next year's payment divided by your required return minus the dividend's growth rate. Compare it with the market price to see whether the shares look cheap or dear — it only works when growth stays below the required return.
The single-stage model breaks down for fast growers — when growth approaches your required return the maths blows up. A two-stage dividend discount model fixes this by splitting the future in two: a few years of rapid growth at the company's recent rate, then a slower, permanent "terminal" rate it can sustain forever. Because the fast phase is finite, it produces a sensible fair value even for the high-growth names the simple model can't touch.
Because every fair value rests on assumptions, Benjamin Graham urged buying only with a margin of safety — a comfortable gap between price and your estimate, so an error in the maths still leaves room to be right. Quantic reads a stock as cheap when the price sits at least 15% below fair value, expensive when 15% above, and fair in between.
Value is also relative: a utility and a software firm are cheap at very different yields. Sector-relative valuation ranks a stock against the other dividend payers in its own sector, shown as a percentile — "cheaper than 78% of the sector" — so you're comparing like with like rather than against the whole market.
Dividend Yield Theory, popularised by Geraldine Weiss, reads a quality payer's own history: when its yield sits near the high end of its usual range the stock is relatively cheap, and near the low end it's expensive. The implied fair price is the annual dividend divided by that average historical yield.
Finally, the dividend's growth streak shows how battle-tested it is: 5+ years marks a Challenger, 10+ a Contender, 25+ a Champion (an "aristocrat"), and 50+ a King.
Quantic rolls these angles into a single 0–10 value score — combining the P/E, where the yield sits in its own range (Dividend Yield Theory), and the price versus fair value — so you can screen and compare stocks on how cheap they look at a glance. Higher means cheaper; it's a starting point, not a verdict.
Valuations are estimates built on assumptions — a starting point for research, never a recommendation.
Key terms
- Chowder number
- A dividend-growth screen: the current yield plus the 5-year dividend growth rate. A common rule of thumb wants at least 8% for higher-yield stocks (yield above 3%) or 12% otherwise — a quick gauge of total dividend-return potential.
- Fair value (DDM)
- An estimate of what a share is worth based on its dividend: next year's dividend divided by the required return minus the dividend growth rate (the Gordon Growth model). Compared with the price to flag under- or over-valuation; it only applies when growth stays below the required return.
- Two-stage DDM
- A dividend discount model with two phases: a few years of fast growth at the company's recent rate, then a slower, permanent "terminal" rate. Because the fast phase is finite, it can value fast growers where the simple Gordon Growth model breaks down (when growth is close to or above the required return).
- Margin of safety
- Benjamin Graham's idea of only buying when the price sits a comfortable distance below your fair-value estimate, leaving room for error. Here a stock reads "cheap" when the price is at least 15% below fair value, "expensive" when 15% above, and "fair" in between.
- Sector-relative valuation
- How cheap a stock looks compared with the other dividend payers in its own sector, rather than against the whole market. Shown as a percentile: "cheaper than 78% of the sector" means only 22% of its peers screen as better value on the same yardstick.
- Dividend Yield Theory
- A valuation idea (Geraldine Weiss): a quality dividend payer is relatively cheap when its yield is near the high end of its own historical range, and expensive near the low end. The implied fair price is the annual dividend divided by the stock's average historical yield.
- Dividend growth streak
- The number of consecutive years a company has raised its dividend. A long streak signals reliability; 25+ years earns the "dividend aristocrat" label.
- Value score
- Quantic's 0–10 read on how cheap a dividend stock looks, combining its P/E, where its yield sits in its own 5-year range (Dividend Yield Theory), and its price versus a fair-value estimate. Higher = cheaper.
Quantic · Free
Ready to put it into practice?
Explore a sample portfolio — no signup — or create your free account and start tracking your own dividends.
Need more? Pro adds portfolios, options income tracking & more AI. See Pro →